World Energy Outlook
Introduction
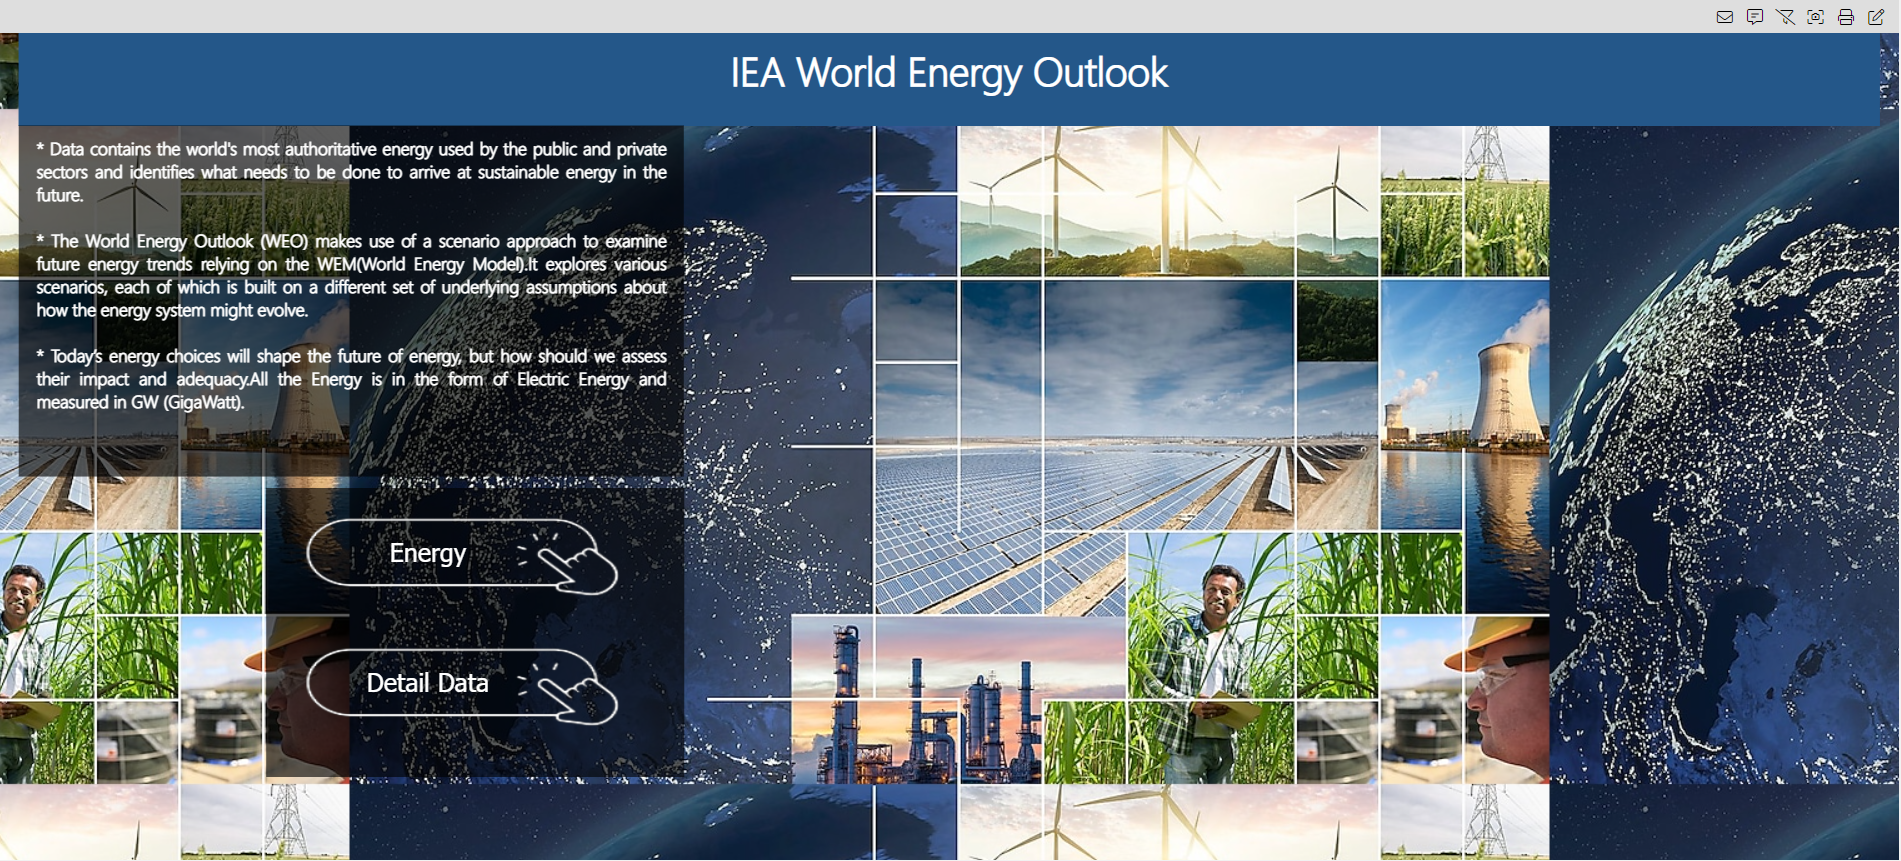
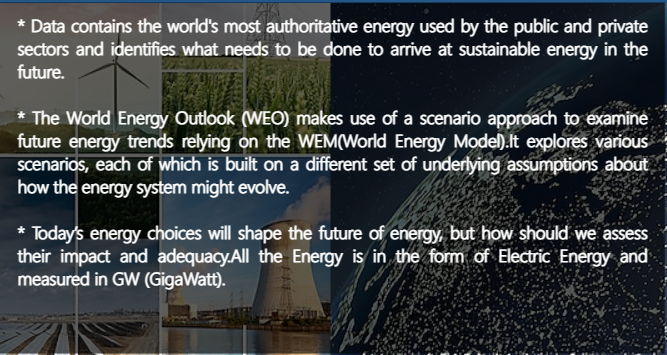
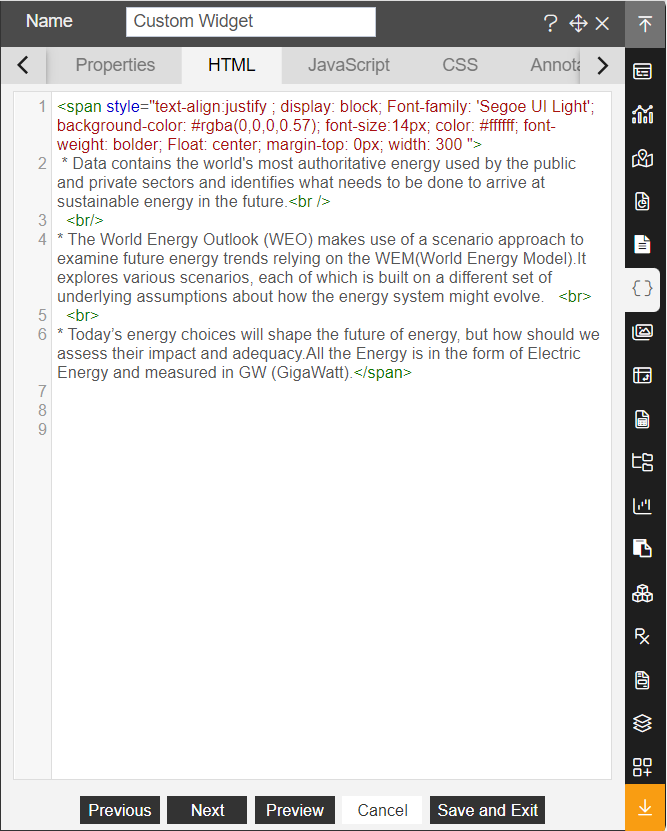
Data contains the world's most authoritative energy used by the public and private sectors and identifies what needs to be done to arrive at sustainable energy in the future.
The World Energy Outlook (WEO) makes use of a scenario approach to examine future energy trends relying on the WEM(World Energy Model). It explores various scenarios, each of which is built on a different set of underlying assumptions about how the energy system might evolve.
Today’s energy choices will shape the future of energy, but how should we assess their impact and adequacy. All the Energy is in the form of Electric Energy and measured in GW (GigaWatt).
Prerequisites:
Download the “World Energy Outlook.zip” file from Marketplace you should get the following folder structure.
• dashboards
• datasets
• datasources
• reports
• images
• resources
Overview Tab:
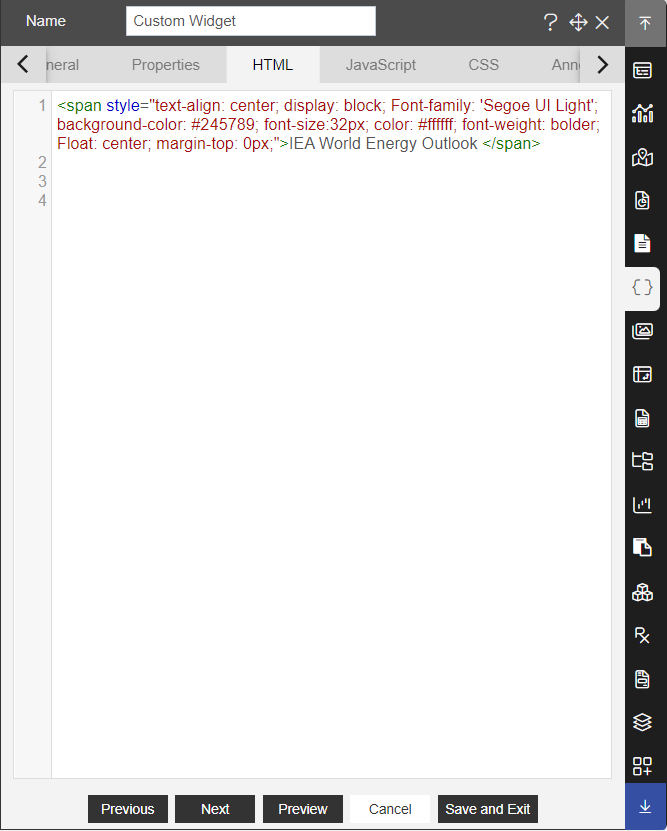
IEA world energy Outlook Title:

Download WorldEnergyCode.zip file from here
From the right vertical menu select the Custom Visualization Widget and update the Properties, as below:
In HTML Properties enter the HTML code Provided in the IEA world energy Title file.
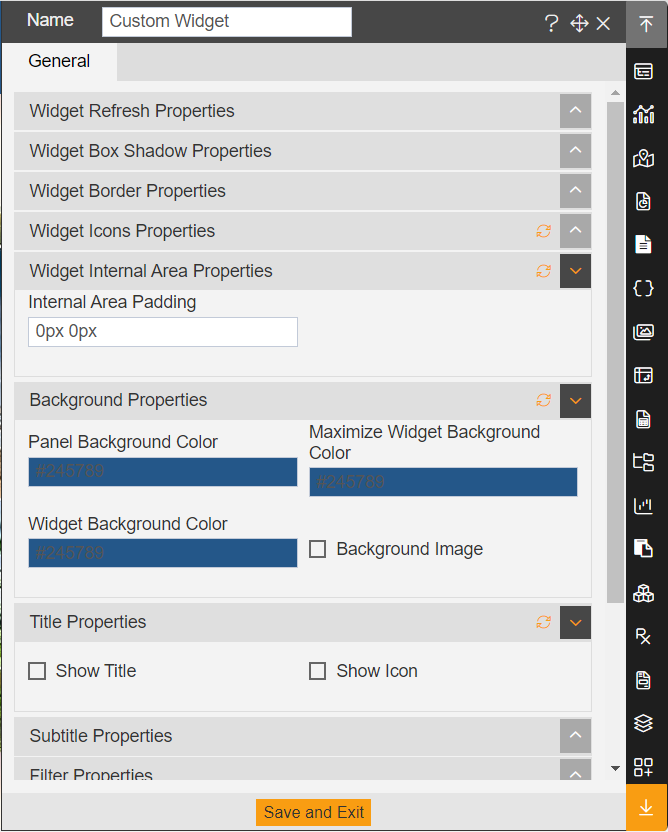
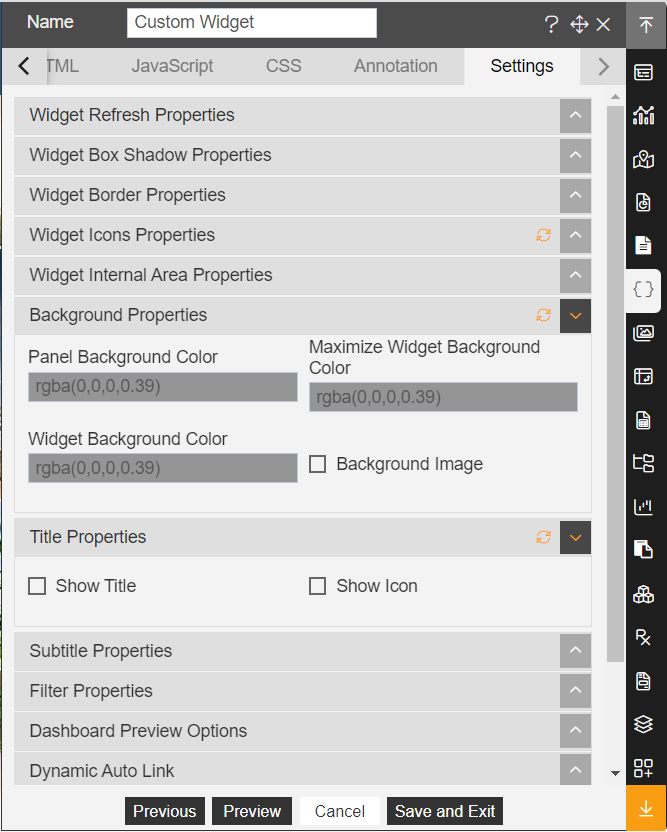
Go to the Widget Setting and enter the following details in Widget Internal Area Properties:
Internal Area Padding: 0px 0px
Enter the following details in Background Properties:
Panel Background Color: #245789

Maximize Widget Background Color: #245789

Widget Background Color: #245789
Enter the following details in Title Properties:
Show Title: Disable
Fill above details, as shown in the figure below:
Click on Save and Exit.
Description:
From the right vertical menu select the Custom Visualization Widget and update the Properties, as below:
In HTML Properties enter the HTML code Provided in the overview description file.
Go to the Widget Setting and enter the following details in Background Properties:
Panel Background Color: rgba(0,0,0,0.39)

Maximize Widget Background Color: rgba(0,0,0,0.39)

Widget Background Color: rgba(0,0,0,0.39)
Enter the following details in Title Properties:
Show Title: Disable
Fill above details, as shown in the figure below:
Click on Preview and Save and Exit.
Button:
From the right vertical menu select the Custom Visualization Widget and update the Properties, as below:
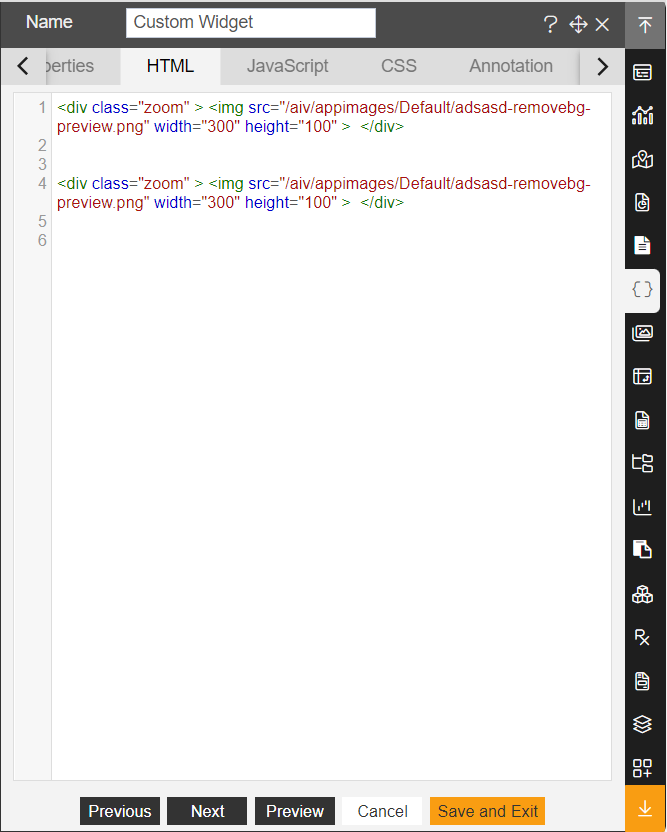
In HTML Properties enter the HTML code Provided in the energy and detail data button file.
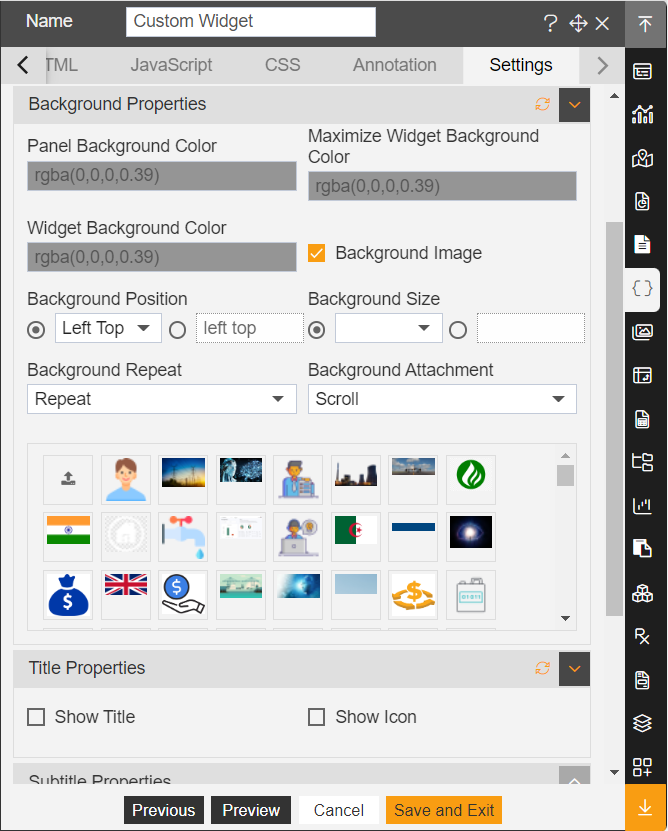
Go to the Widget Setting and enter the following details in Background Properties:
Panel Background Color: rgba(0,0,0,0.39)

Maximize Widget Background Color: rgba(0,0,0,0.39)

Widget Background Color: rgba(0,0,0,0.39)

Background Image : Enable
Enter the following details in Title Properties:
Show Title: Disable
Fill above details, as shown in the figure below:
Click on Preview and Save and Exit.

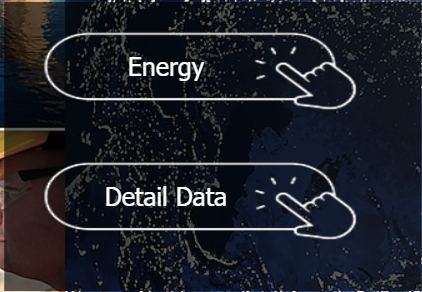
Energy & Detail Data Button:
Energy: It will redirect on Energy Tab.
From the right vertical menu select the Custom Visualization Widget and update the Properties, as below:
In HTML Properties enter the HTML code Provided in the energy file.
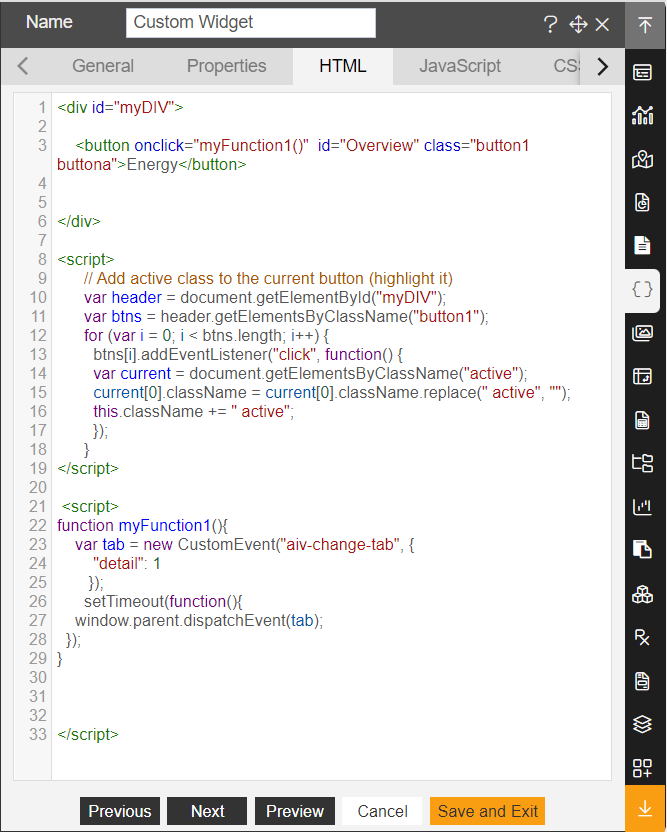
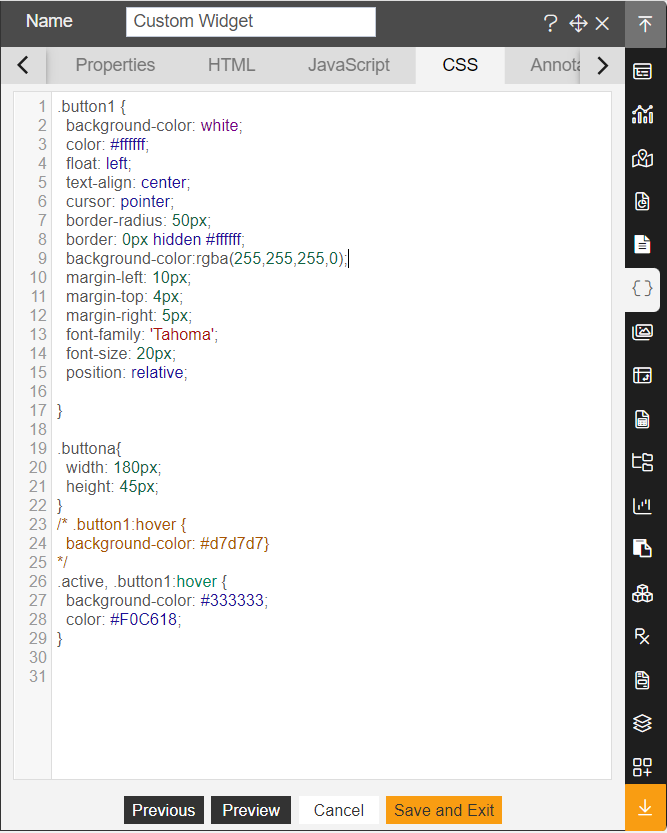
In CSS Properties enter the CSS code Provided in the energy file.
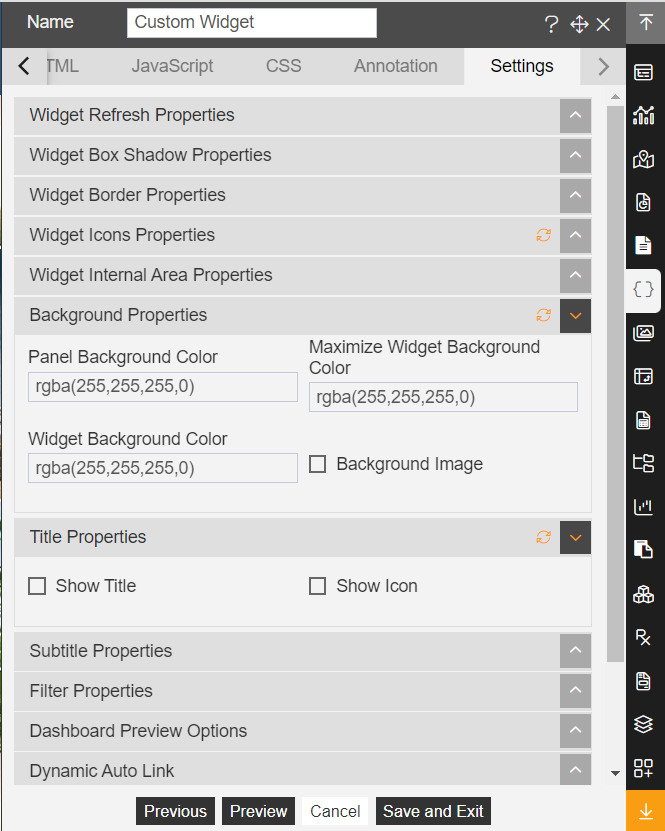
Go to the Widget Setting and enter the following details in Background Properties:
Panel Background Color: rgba(255,255,255,0)

Maximize Widget Background Color: rgba(255,255,255,0)

Widget Background Color: rgba(255,255,255,0)

Background Image : Enable
Enter the following details in Title Properties:
Show Title: Disable
Fill above details, as shown in the figure below:
Click on Preview and Save and Exit.
Click on the Ellipse icon ![]() of the widget and select the Bring forward option.
of the widget and select the Bring forward option.

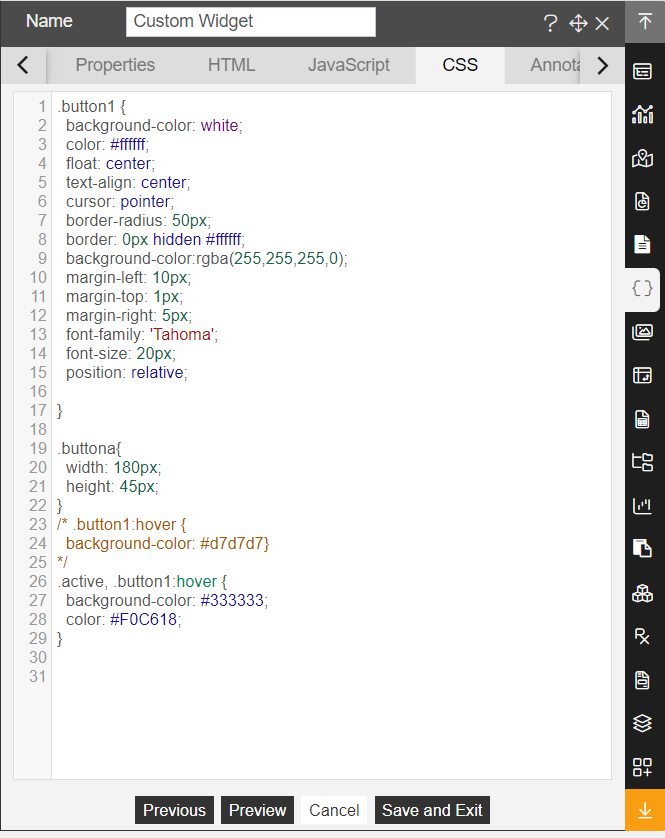
Detail Data: It will redirect to Detail Data Tab.
From the right vertical menu select the Custom Visualization Widget and update the Properties, as below:
In HTML Properties enter the HTML code Provided in the detail data file.
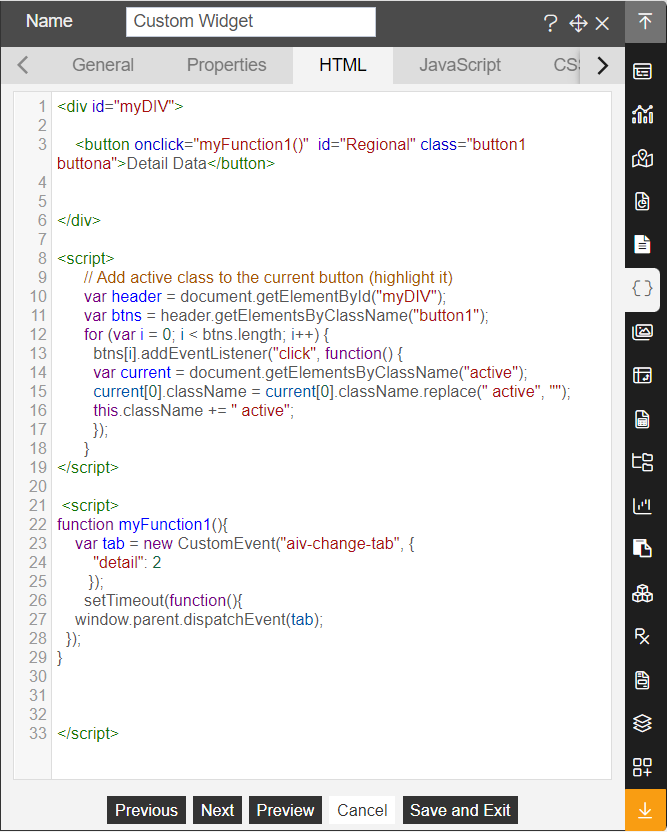
In CSS Properties enter the CSS code Provided in the detail data file.
Go to the Widget Setting and enter the following details in Background Properties:
Panel Background Color: rgba(255,255,255,0)

Maximize Widget Background Color: rgba(255,255,255,0)

Widget Background Color: rgba(255,255,255,0)

Background Image : Enable
Enter the following details in Title Properties:
Show Title: Disable
Fill above details, as shown in the figure below:
Click on Preview and Save and Exit.
Click on the Ellipse icon ![]() of the widget and select the Bring forward option.
of the widget and select the Bring forward option.

Energy Tab:
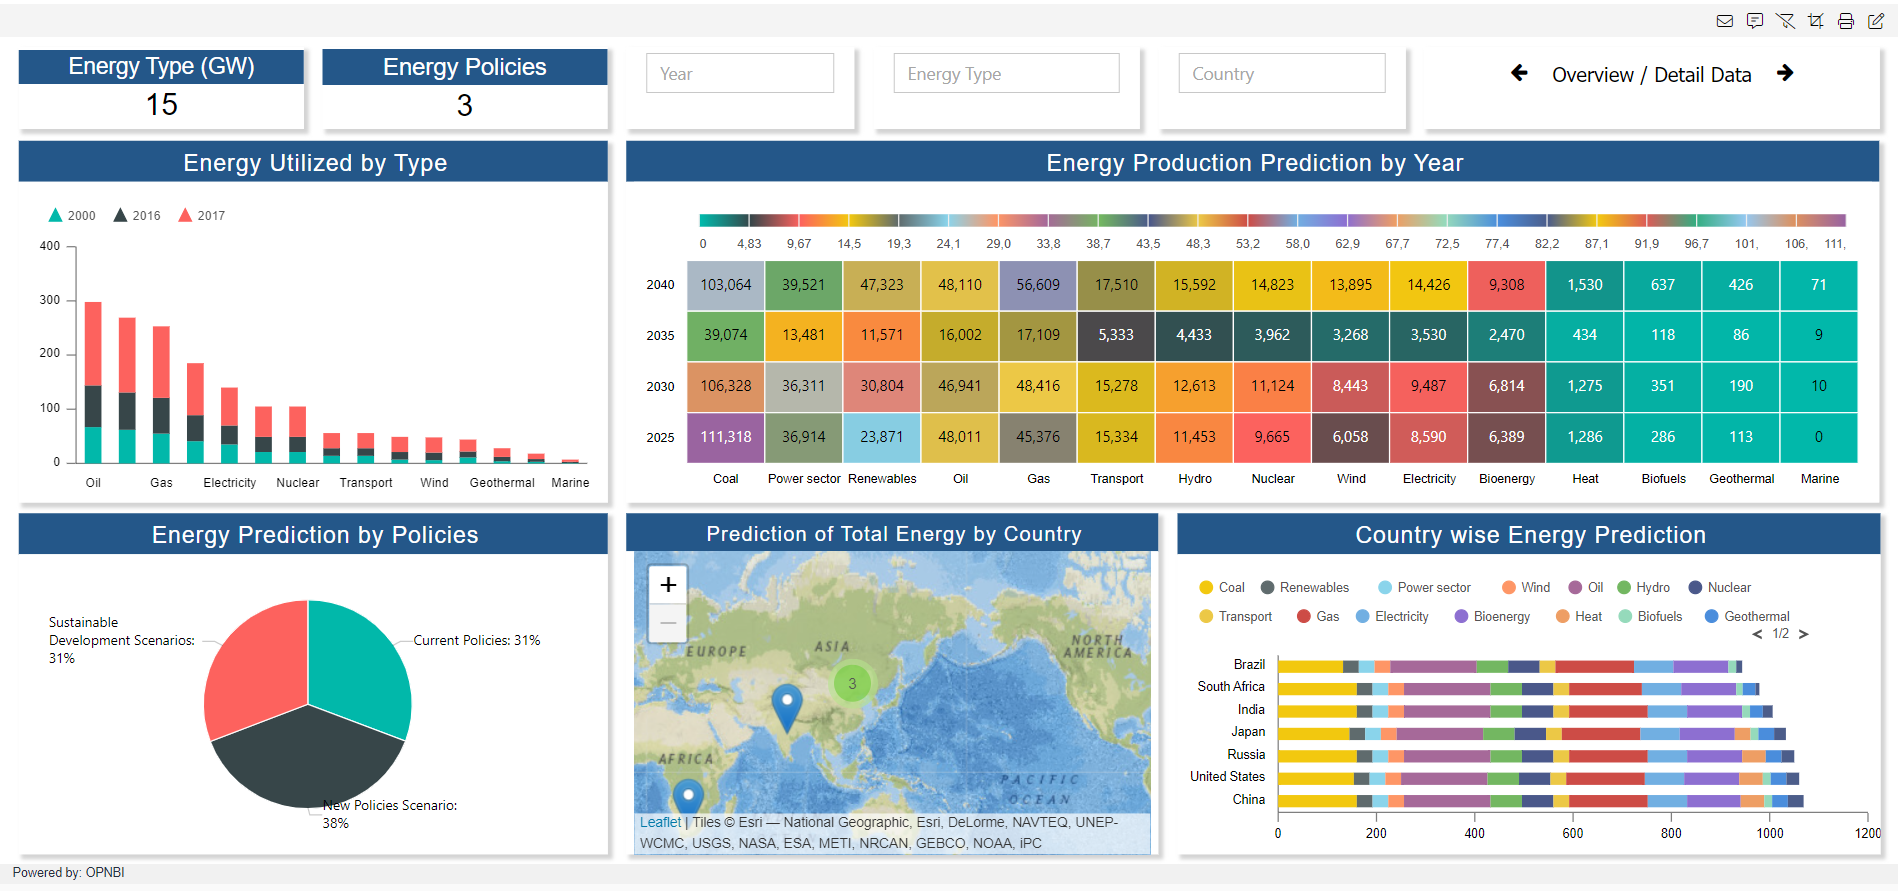
Energy Type: It displays the total types of energy.

From the right vertical menu select the Card Widget and update the card Properties, as below:
Name: Indicator

Dataset: World Energy
Enter the following details in Card General Property
Select Columns: Indicator_Name

Aggregation: Distinct Count
Enter the following details in Style Property
Font Size: 24

Paddding: 3

Background Color: rgba(255,255,255,0)

Align: Center
Enter the following details in Formatting Property
Decimal Place: 0
Enter the following details in Title Property
Title: Energy Type (GW)

Title Position: Top

Title Font Size: 18

Padding: 3

Background Color: #245789

Title Align: Center
Fill above details, as shown in the figure below:
Go to the Widget Setting and enter the following details in Widget Box Shadow Properties:
Box Shadow:** Enable

Box Shadow Horizontal: 3

Box Shadow Vertical: 3

Box Shadow Color: #d3d3d3

Box Shadow Blur: 3
Enter the following details in Widget Internal Area Properties:
Internal Area Padding: 0px 0px
Enter the following details in Title Properties:
Show Title: Disable
Fill above details, as shown in the figure below:
Click on Save and Exit.
Click on the Ellipse icon ![]() of the KPI widget and select the copy option.
of the KPI widget and select the copy option.
It will display the dialog box, as shown in the figure below:
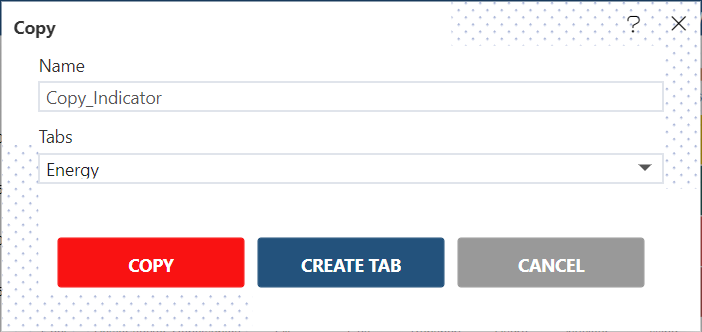
Click on the copy.
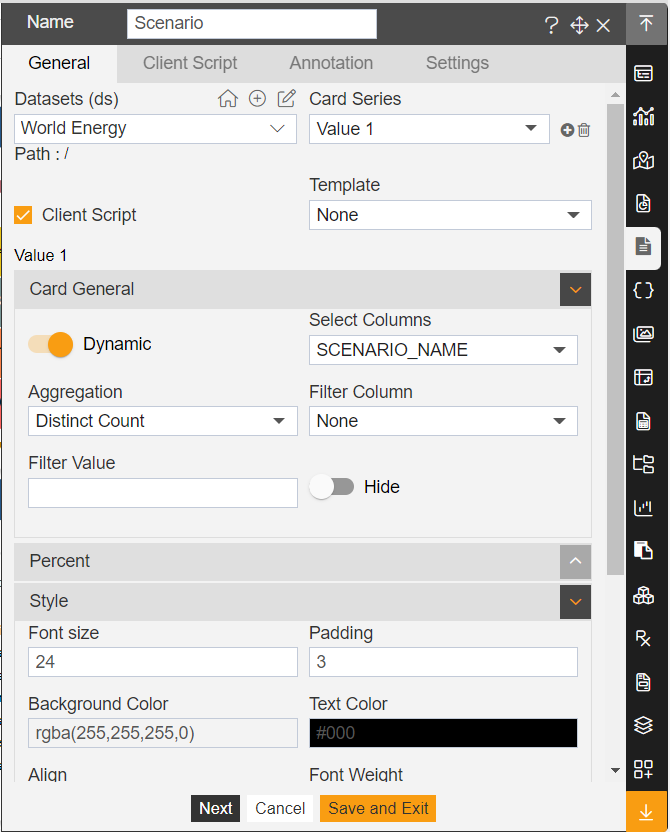
Energy Policies It displays total Energy Policy types.

Enter the following details in the Energy Policies KPI Widget.
Name: Scenario

Client Script: Enable (Code Provided in the **Energy Policies** file)
Enter the following details in Card General Properties
Select Column:** Scenario_Name
Enter the following details in Title Property
Title: Energy Policies
Click on Save and Exit.
Energy Utilized by Type: It displays the types of energy utilized by the years 2000, 2016, and 2017.
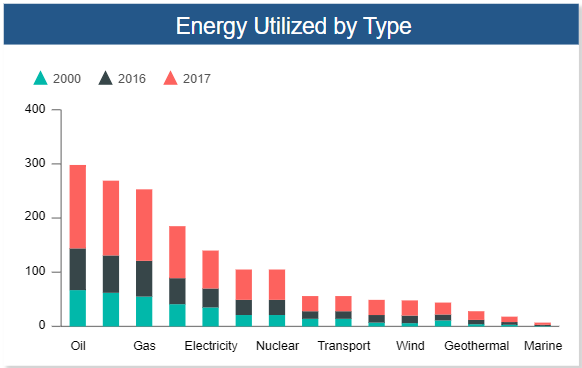
From the Right vertical menu select the chart widget and enter the following details in the Stacked Column Chart Property.
Name: Energy Utilized by Type

Dataset: World Energy .ds

Client Script: Enable (Client script provided in **energy utilized by type** file)

Category Axis: Indicator_Name

Value Column: Value

Aggregation: Count

Optional Y Series Grouping: Year
Go to the Formatting property and enter the following details in General.
Color & Theme Property: Enable Match Global color

Chart Sorting based on Value: Descending

Chart Tooltip >> Tooltip Text: ${series.name} ${point.x} : ${point.y}GW
Enter the following details in the Category Axis Property.
Category Ticks: Disable
Enter the following details in Series Property.
Series Legend Shape: Triangle
Enter the following details in Legend Property.
Legend Properties: Enable Legend

Inherit Property from Series: Disable Default Markers

Legend Sort Property: Ascending
Go to the Widget Setting and enter the following details in Widget Box Shadow Properties:
Box Shadow: Enable

Box Shadow Horizontal: 3

Box Shadow Vertical: 3

Box Shadow Color: #d3d3d3

Box Shadow Blur: 3
Enter the following details in Widget Icon Properties:
Hide Icon In Preview: Disable

Hide Maximize Icon: Enable

Hide Download Icon: Enable
Enter the following details in Title Properties:
Title Move To: Center

Title Font Size: 18

Title Background Color: #245789

Padding: 8px 4px 4px 8px
Enter the following details in Filter Properties:
Show Filter Value: Enable
Click on Save and Exit.
Energy Production Prediction by Year: This Widget displays the Prediction of Energy Production by the years 2025, 2030, 2035, and 2040.
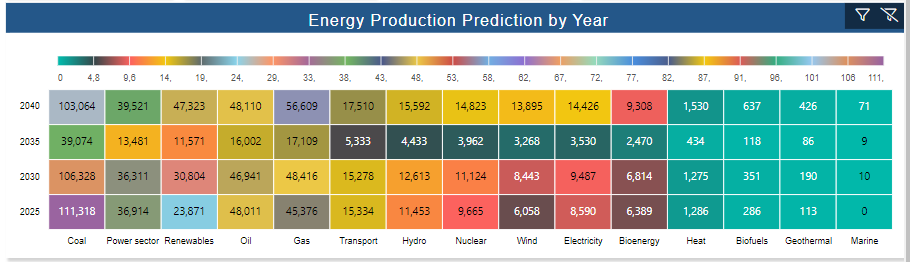
From the right vertical menu select the chart widget and enter the following details in Heatmap.
Name: Energy Production Prediction by Year

Dataset: World Energy .ds

Client Script: Enable (Client script provided in Energy Production Prediction by Year file)

Category Axis: Indicator_Name

Y Series: Year

Value Column: Value

Aggregation: Sum
Go to the Widget Setting and enter the details (follow the Widget setting property of Energy Utilized by Type chart)
Click on Save and Exit.
Energy Prediction by Policies: It Displays the Prediction of three types of Policies.
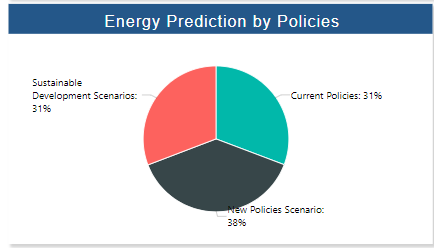
From the right vertical menu select the chart widget and enter the following details in Pie Chart.
Name: Energy Prediction by Policies

Dataset: World Energy .ds

Client Script: Enable (Client script provided in Energy Prediction by Policies file)

Category Axis: Scenerio_Name

Value Column: Value

Aggregation: count
Go to the Formatting property and enter the following details in General.
Chart Appearance >> Radius: 76

Chart Tooltip >> Tooltip Text: ${series.name} ${point.x} : ${point.y}GW
Enter the following details in Series.
Series Labels: Wrap Enable
Go to the Widget Setting and enter the details (follow the Widget setting property of Energy Utilized by Type chart)
Click on Save and Exit.
Prediction of Total Energy by Country: It displays Country-wise Total Energy Prediction.
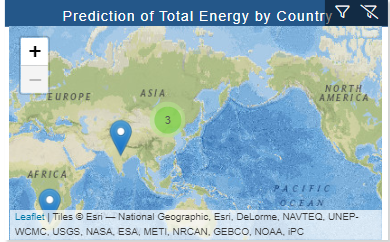
From the right vertical menu select the Map widget and enter the following details in Leaflet.
Name: Prediction of Total Energy  by Country

Dataset: World Energy .ds

Client Script: Enable (Client script provided in Prediction of Total Energy  by Country file)

Map Type: Country

Location: Region_Name

Value: Value

Aggregation: Sum
Go to the Widget Setting and enter the details (follow the Widget setting property of Energy Utilized by Type chart)
Click on Save and Exit.
Country-wise Energy Prediction: It displays country-wise energy prediction.
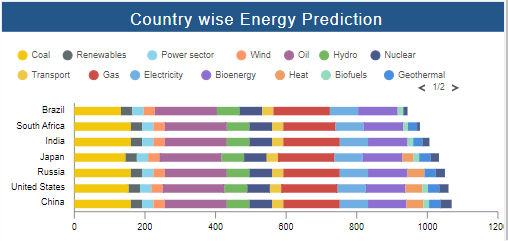
From the right vertical menu select the chart widget and enter the following details in Stacked Bar Chart.
Name: Country-wise Energy Prediction

Dataset: World Energy .ds

Client Script: Enable (Client script provided in **Energy Prediction by Policies** file)

Category Axis: Region_Name

Value Column: Value

Aggregation: count

Optional Y Series Grouping: Indicator_Name
Go to the Formatting property and enter details in General, Category Axis (follow as the Widget Formatting property of Energy Utilized by Type chart.
Enter the following details in Series Property
Series General Properties >> Column Width: 74
Enter the following details in Legend Property
Legend Property: Disable Legend

Inherit Property from Series: Disable default Marker
Go to the Widget Setting and enter the details (follow the Widget setting property of Energy Utilized by Type chart)
Click on Save and Exit.
Year Filter: It displays the list of the year.

From the top right corner of the dashboard click on the filter Icon ![]() .
.
Click on + Icon ![]() to add filter and enter following details in it.
to add filter and enter following details in it.
Name: Year

Event: On Change
Click on the Setting icon and enter the following details in the Filter widget.
Source: Dataset

Display Type: Multi-Select

Dataset: World Energy

Column_Name: Year
Enter the following details in the Link Filter and widget Property.
Layer: Layer1

Tab: Energy, Detail Data

Widgets: (Select all the widgets one by one and link the Year column with all the widgets)
Go to the Filter Property and add Energy Policy, Country, and Energy Type Filter.
Energy Policy
![]()
Name: Energy Policy

Event: On Change

Source: Dataset

Display Type: Multi Select

Dataset: World Energy

Column_Name: Scenario_Name
Enter the following details in the Link Filter and widget Property.
Layer: Layer1

Tab: Energy, Detail Data

Widgets: (Select all the widgets one by one and link Scenario_Name column with all the widgets)
Country
![]()
Name: Country

Event: On Change

Source: Dataset

Display Type: Multi Select

Dataset: World Energy

Column_Name: Region_Name
Enter the following details in the Link Filter and widget Property.
Layer: Layer1

Tab: Energy, Detail Data

Widgets: (Select all the widgets one by one and link Region_Name column with all the widgets)
Energy Type:
![]()
Name: Energy Type

Event: On Change

Source: Dataset

Display Type: Multi Select

Dataset: World Energy

Column_Name: Indicator_Name
Enter the following details in the Link Filter and widget Property.
Layer: Layer1

Tab: Energy, Detail Data

Widgets: (Select all the widgets one by one and link Indicator_Name column with all the widgets)
Go to the filter View Property and Click on the + icon of Year, Energy Type add Country to add a filter in the Energy Tab of the dashboard.
Click on Save and Exit.
Overview / Detail Data

From the right vertical menu add Custom Visualization Widget in the dashboard.
Enter the code in HTML Property (HTML code provided in overview and detail data key in energy tab file)
Go to the Widget Setting and enter the details (follow the Widget setting property of Energy Utilized by Type chart)
Title Properties: Disable Show Title
Click on Save and Exit.
Detail Data
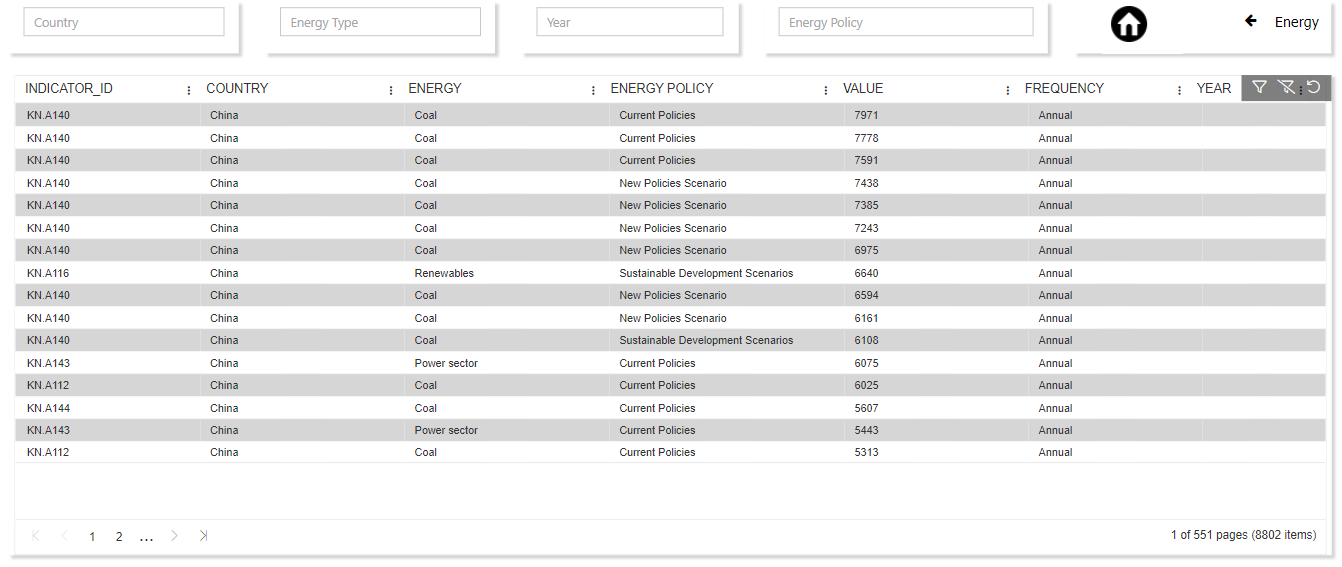
Go to the filter View Property and Click on the + icon of Year, Energy Type, Country, Energy Policy to add a filter in the Energy Tab of the dashboard.
Click on Save and Exit.
Detail Data Table Widget:
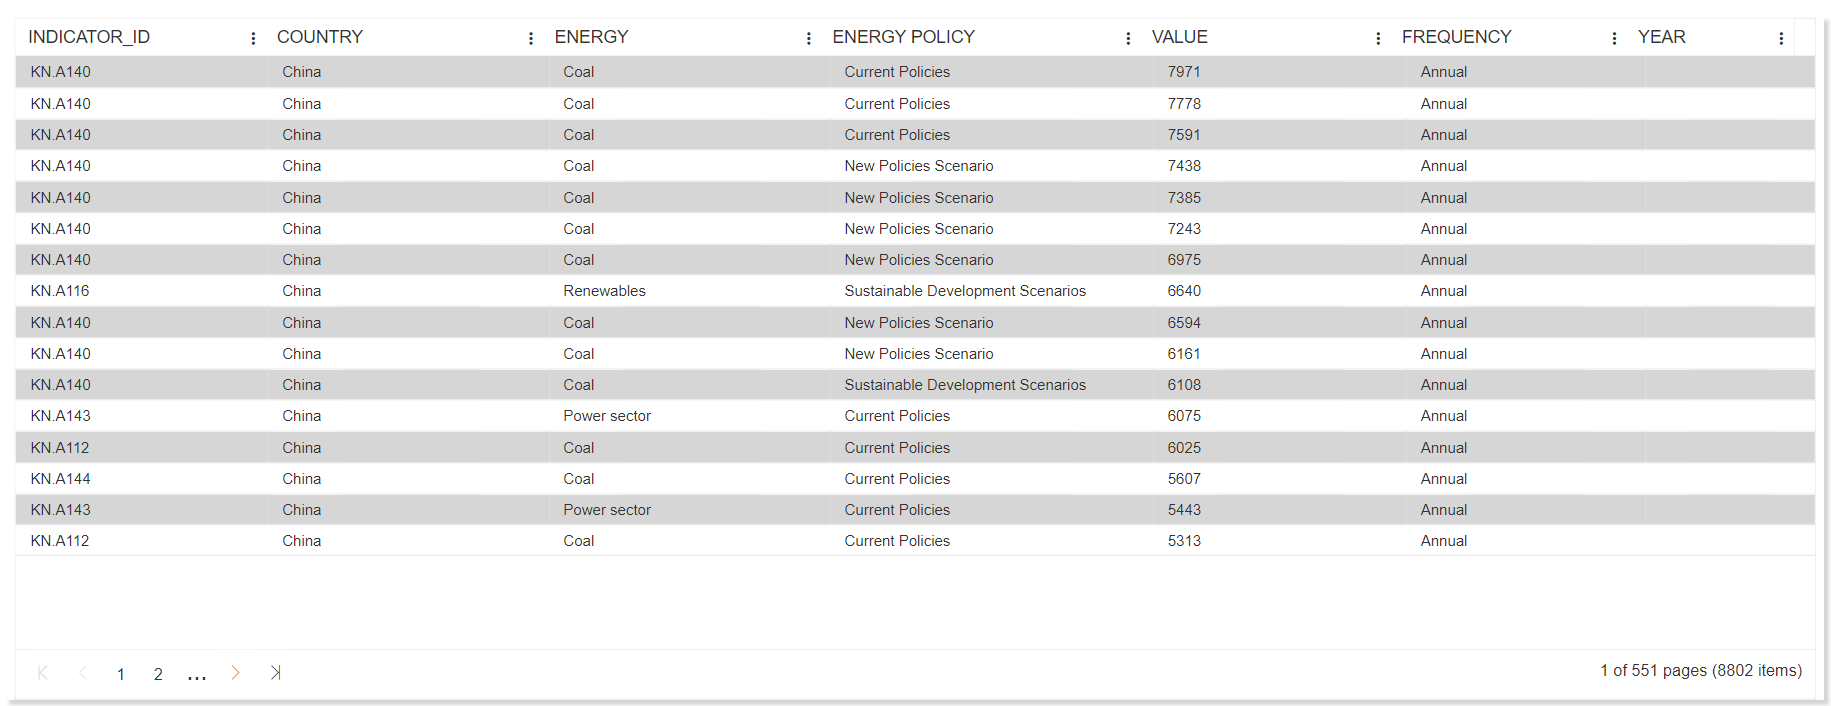
From the right vertical menu add Table Widget in the dashboard.
Enter the following details in the General Property.
Dataset: World Energy

**Dataset Column: Select all the fields
Go to the Widget Setting and enter the details (follow the Widget setting property of Energy Utilized by Type chart)
Title Properties: Disable Show Title
Click on Save and Exit.
Home Icon

From the right vertical menu add Custom Visualization Widget in the dashboard.
Enter the code in HTML Property (HTML code provided in home icon file)
Enter the code in JavaScript Property (JavaScript code provided in home icon file)
Enter the code in CSS Property (CSS code provided in home icon file)
Go to the Widget Setting and enter the details (follow the Widget setting property of Energy Utilized by Type chart)
Title Properties: Disable Show Title
Click on Save and Exit.
Energy
![]()
From the right vertical menu add Custom Visualization Widget in the dashboard.
Enter the code in HTML Property (HTML code provided in energy key in detail data file)
Go to the Widget Setting and enter the details (follow as the Widget setting property of Energy Utilized by Type chart)
Title Properties: Disable Show Title
Click on Save and Exit.